From Dashboard Hell to One-Click WBRs: Automating Amazon's Weekly Business Review
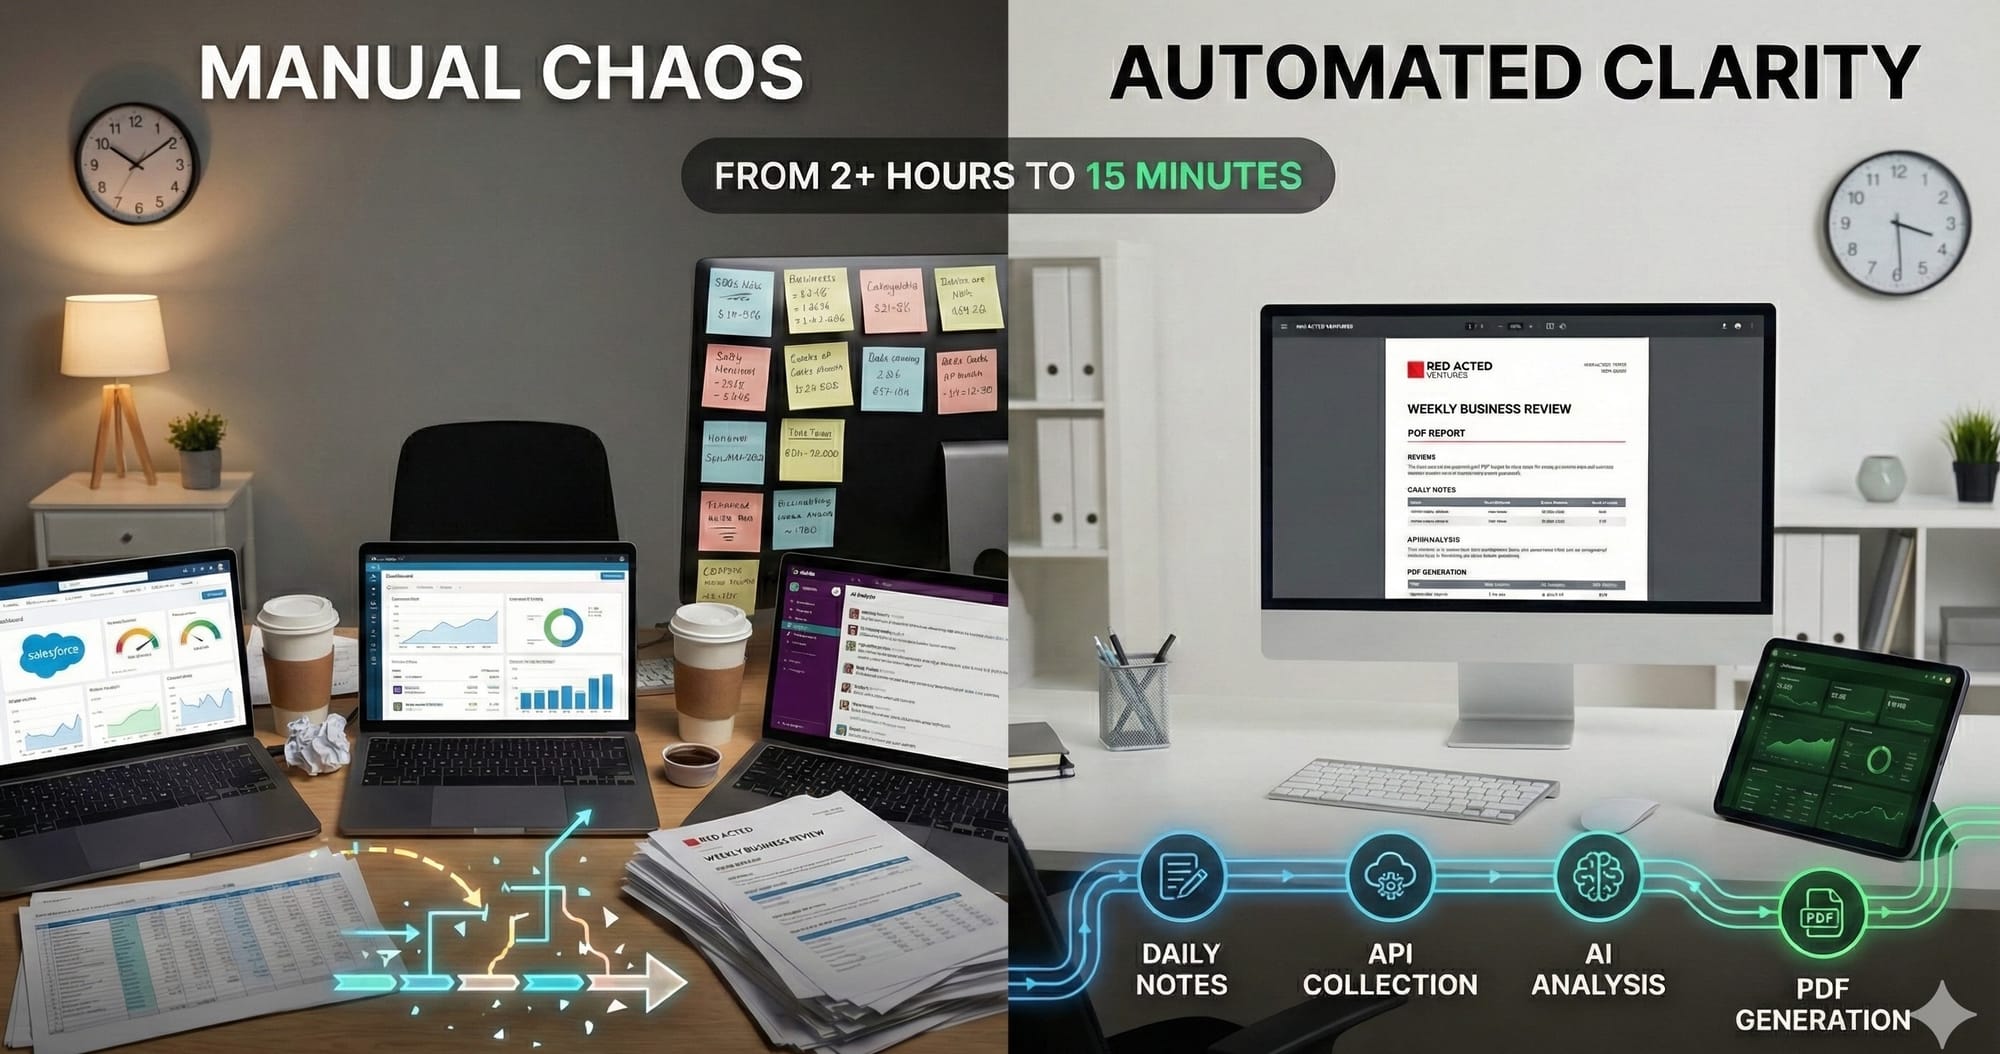
I spent 2-4 hours weekly on Amazon WBRs at AWS. Now it takes 15 minutes. Here's the automation system I built.

As a Director at AWS, I spent countless hours each week on a ritual that every Amazon leader knows well: creating the Weekly Business Review (WBR). These documents are the operational heartbeat of Amazon—data-driven snapshots that force clarity, accountability, and systematic improvement.
But here's the irony I lived every week: while I was building cloud automation tools that helped customers eliminate manual toil, I was manually assembling my own WBRs. Every week, leading up to our Tuesday WBR meeting, I'd be stuck in the same exhausting cycle:
- Log into Salesforce to manually pull pipeline metrics and deal stages
- Switch to Quick Sight (AWS's internal analytics tool) for customer health scores
- Navigate to different operational dashboards for separate metrics—each with its own login, date range, and export quirks
- Track down teammates via Slack or email to gather their numbers
- Chase down stakeholders for qualitative updates on customer conversations
- Manually aggregate everything into a coherent narrative
- Realize data conflicts between systems and spend time reconciling
- Update the document late Monday night when the data finally comes together
The problem wasn't just the time—it was the fragmentation. Critical business data lived in silos across Salesforce, Quick Sight, Slack conversations, email threads, and people's memories. By Tuesday morning, I'd cobbled together a WBR, but I'd lost 2-4 hours across the week that could have been spent actually improving the business.
Fast forward to today. I am running my own business again, and I've finally automated what I wish I'd built at AWS. My WBR now takes 15 minutes instead of 2+ hours. The data is always current. Nothing gets forgotten. And the system runs itself while I focus on what matters: using the insights to make better decisions.
Here's the thing: I wouldn't use WBRs for a small business if they weren't automated. The formality and overhead of a traditional WBR process—dashboards, spreadsheets, manual aggregation—would be absurd for Redacted Ventures. It's the kind of enterprise rigor that only makes sense at Amazon scale.
But because my WBR is completely automated and the data is high-fidelity (based on my daily inputs and systematic collection), it's actually a no-brainer. I get the operational clarity of an Amazon WBR without the operational burden. Automation changed the cost/benefit equation entirely.
This post shares how I built a fully automated WBR system—and how you can do the same, whether you're running a startup, a small business, or leading a team at a Fortune 500.
What is a Weekly Business Review (and Why Does Amazon Swear By It)?
For those who haven't experienced Amazon's operational discipline firsthand, the Weekly Business Review is a forcing function for clarity. Every week, leaders must:
- Report input metrics (what you control) not just output metrics (what happened as a result)
- Compare week-over-week trends to spot patterns early
- Surface issues proactively before they become crises
- Commit to specific next actions with owners and dates
The format is standardized, data-driven, and unflinching. If your metrics are red, you explain why and what you're doing about it. If they're green, you identify what's working and how to sustain it.
As described in Working Backwards by former Amazon executives Colin Bryar and Bill Carr, WBRs create a "single-threaded" focus on controllable inputs that drive business outcomes. The discipline of weekly measurement prevents drift and creates tight feedback loops.
In their chapter on Input Metrics & Weekly Business Review, they emphasize something that Amazon founder Jeff Bezos would often say: "Good intentions don't work. Mechanisms do."
That phrase haunted me every week as I manually cobbled together my WBR. I knew the mechanism was sound. But the execution was manual, error-prone, and soul-crushing.
The Business Challenge: Manual WBR Assembly is Painful and Inaccurate
Let's break down what made manual WBR creation so problematic:
The Dashboard Gauntlet
To assemble a single WBR, I needed data scattered across multiple systems:
- Salesforce: Pipeline metrics, deal stages, win rates, customer health scores
- Quick Sight (AWS's internal analytics): Operational metrics, usage patterns, customer adoption
- Internal dashboards: Service health, support ticket volumes, escalations
- Customer interactions: Calls, meetings, engagements—scattered across calendars, notes, and memory
- Slack conversations: Track down team members for their updates
- Email threads: Hunt for customer feedback, decisions made during the week
- Direct conversations: Walk to desks or schedule calls to gather qualitative context
- My own memory: What actually happened (the least reliable source)
Each dashboard had different date ranges, different filters, different export formats. Quick Sight required custom queries. Some systems had no export function at all—just manual copy-paste into Excel, then copy-paste into the WBR document. And for anything qualitative, I had to talk to people—which meant waiting for responses, scheduling time, or tracking folks down in Slack.
The Memory Problem
By Monday night when I was assembling the WBR for Tuesday's meeting, I could barely remember what happened the previous Wednesday, let alone the details that mattered for meaningful analysis. Did that customer call go well? What was the specific blocker we identified? Who committed to fixing it, and by when?
Without a system to capture context as it happened, my WBR became a fuzzy reconstruction rather than an accurate record. I'd ping teammates: "Hey, what were the highlights from your area this week?" And they'd struggle to remember too.
The Comparison Gap
Week-over-week comparison is where WBRs generate real insight. But when you're manually assembling data, creating comparisons is painful:
- "What was last week's number again?"
- "Did we change how we calculate this metric?"
- "Why does this number look different from last week's report?"
You end up with snapshots, not trends. Moments, not patterns.
The Weekly Tax
Manual WBR creation consumed 2-4 hours spread across the week—10 minutes here logging into Salesforce, 20 minutes there chasing down teammates, an hour Monday night aggregating everything for Tuesday's meeting. That's 5-10% of my week spent on administrative busywork instead of strategic thinking, customer conversations, or helping my team.
And because it was so painful and fragmented, I'd procrastinate the synthesis. Which meant I'd be assembling the final WBR document at 10 PM Monday night when I should have been reviewing it with fresh eyes and preparing thoughtful recommendations for the Tuesday meeting.
The Solution: A Self-Reinforcing WBR Mechanism
When I started my own business, I refused to repeat this pattern. I built what I wish I'd had at AWS: a complete WBR automation system based on Amazon's own principle of mechanisms over good intentions.
Following the seven-component mechanism framework (from the "Mechanisms" approach Amazon uses), here's what I built:
1. Business Challenge
Manual WBR assembly is time-consuming, error-prone, and prevents real-time insight into business health.
2. Outputs
- WBR generation time: < 15 minutes (down from 2+ hours)
- Data accuracy: 100% (automated collection eliminates copy-paste errors)
- Week-over-week comparison: Automatic (no manual lookups)
- Context preservation: All qualitative details captured throughout the week
3. Tools
The system has three main components:
Daily Notes System (Capture context as it happens)
Instead of trying to remember everything Friday, I capture 2-3 bullets each day:
./new-daily-note.sh -e
This opens a structured template:
## ✨ Highlights
- What went well today

## 📉 Lowlights
- What didn't go well

## 📋 Projects & Milestones
- What I worked on

## 👀 Observations
- Patterns, insights, learnings
Takes 2 minutes per day. Eliminates the memory problem entirely.
Automated Metrics Collection (No more dashboard gauntlet)
Two copy-paste prompts for Claude:
- Data Collection Prompt - Uses Claude Chrome plugin to automatically scrape:
- Substack: subscribers, views, growth %
- LinkedIn: impressions (30d and 365d), followers
- Google Analytics: sessions, pageviews, active users
- GitHub: stars, forks, traffic for multiple repos
- Medium: views, reads, engagement
- WBR Generation Prompt - Claude:
- Reads the WBR template to extract metric targets
- Fetches the previous week's WBR for comparison
- Performs week-over-week analysis
- Generates complete WBR with all appendices
- Flags anomalies and trends
- Provides actionable recommendations
The entire data collection process: 5 minutes. No manual copy-paste. No forgotten dashboards.
PDF Generation & Validation (Professional output, guaranteed format)
./make-pdf.sh output/wbr-2026-01-30.md
This script:
- Generates both PDF and DOCX formats
- Validates that critical sections fit on page 1 (the 2x2 grid Amazon uses)
- Shows validation results (✓ or ✗)
- Applies consistent styling automatically
If validation fails, Claude adjusts content—no manual CSS tweaking required.
Immutable Snapshots (Week-over-week comparison that actually works)
./snapshot-wbr.sh output/wbr-2026-01-30.md
Creates an immutable snapshot with:
- Markdown source, PDF, DOCX
- Raw metrics JSON from all sources
- SHA256 checksums for integrity
- Metadata (git context, creation time, data lineage)
Snapshots enable:
./compare-wbr.sh 2026-01-24 2026-01-30
Which shows:
- Metrics delta (old → new, % change)
- Content changes (sections added/modified)
- Trend identification (growing, stable, declining)
This is the comparison capability I never had at AWS, now automated.
4. Adoption
To make this mechanism stick, I built in continuous reinforcement:
- Weekly ritual: Every Friday, same process, same commands
- Documentation at multiple levels:
START-HERE.md- 3-step quick startQUICK-REFERENCE.md- One-page cheat sheetMETRICS-GUIDE.md- How to interpret trends
- Copy-paste prompts: No memorization required, just paste into Claude
- Automated validation: The system tells me if something's wrong (e.g., page 1 overflow)
5. Inspection
Real-time monitoring of the mechanism's health:
- Metric trend analysis: Claude flags anomalies (e.g., "3rd week of declining views")
- Comparison reports:
compare-wbr.shshows if data quality is degrading
Snapshot integrity checks: Verify files haven't been modified
cd output/snapshots/2026-01-30
shasum -a 256 -c checksums.sha256
6. Inputs
What the mechanism requires to function:
- Daily notes: 2 minutes per day capturing context
- Platform credentials: Logged into dashboards for Claude Chrome plugin
- Claude API access: For automated generation and analysis
- Python environment: For PDF generation (one-time setup)
- Git repository: For version control and snapshot preservation
7. Iteration
Continuous improvement based on feedback:
- Monthly review: Are the metrics still relevant? Any new data sources?
- Quarterly calibration: Adjust metric targets based on business evolution
- Weekly meta-observation: Is the WBR actually driving better decisions?
- Prompt refinement: Update Claude prompts as I discover better analysis patterns
The Weekly Workflow (15 Minutes, Friday Afternoon)
Here's what my Friday WBR process looks like now:
Step 1: Collect Metrics (5 minutes)
Open docs/PROMPT-DATA-SOURCES-CC-CHROME-PLUGIN.md, copy everything below the --- divider, paste into Claude Chrome plugin while logged into dashboards.
Claude asks:
- "What's today's date?"
- "I'll calculate the week range (Saturday-Friday). Confirm?"
- "Provide The Vibe metrics from Firefox" (different Substack login)
Then Claude automatically collects from all platforms and returns a formatted table.
No manual copy-paste. No hunting for reports. Just copy-paste the prompt and wait 3 minutes. (This is the only manual step remaining—I plan to fully automate even the prompt execution.)
Step 2: Generate WBR (5 minutes)
Open docs/PROMPT-WBR-COMPARATIVE-ANALYSIS.md, copy everything below the --- divider, paste into Claude.
Claude completes a Pre-Flight Checklist:
- Reads
templates/wbr-template.mdto extract metric targets - Asks for the week-ending date
- Requests data: platform metrics, git commits, content published, engagement actions
- Finds previous week's WBR for comparison
Then generates:
- Complete WBR with week-over-week analysis
- All appendices properly formatted (no lists, only tables)
- Trend identification and anomaly flagging
- RICO analysis (Risks, Issues, Challenges, Observations)—only P0/P1 items on page 1
- Actionable next steps with owners and dates
No manual analysis. No remembering last week's numbers. Just review Claude's output.
Step 3: Generate Outputs (3 minutes)
Save Claude's markdown to output/wbr-2026-01-30.md, then:
./make-pdf.sh output/wbr-2026-01-30.md
./snapshot-wbr.sh output/wbr-2026-01-30.md
Professional PDF, immutable snapshot, ready for review.
Step 4: Review & Act (2 minutes)
Open the PDF. Scan the 2x2 grid on page 1:
- Input Metrics: Are my controllables trending right?
- Output Metrics: Are results following inputs as expected?
- RICO (P0/P1 only): What needs immediate attention?
- Next Steps: Who's doing what by when?
This is the part that matters. And because data collection and formatting are automated, I can spend my energy here instead of on administrative busywork.
What the Final WBR Looks Like
Here's an example of the automated WBR output—professionally formatted, data-rich, ready for review:
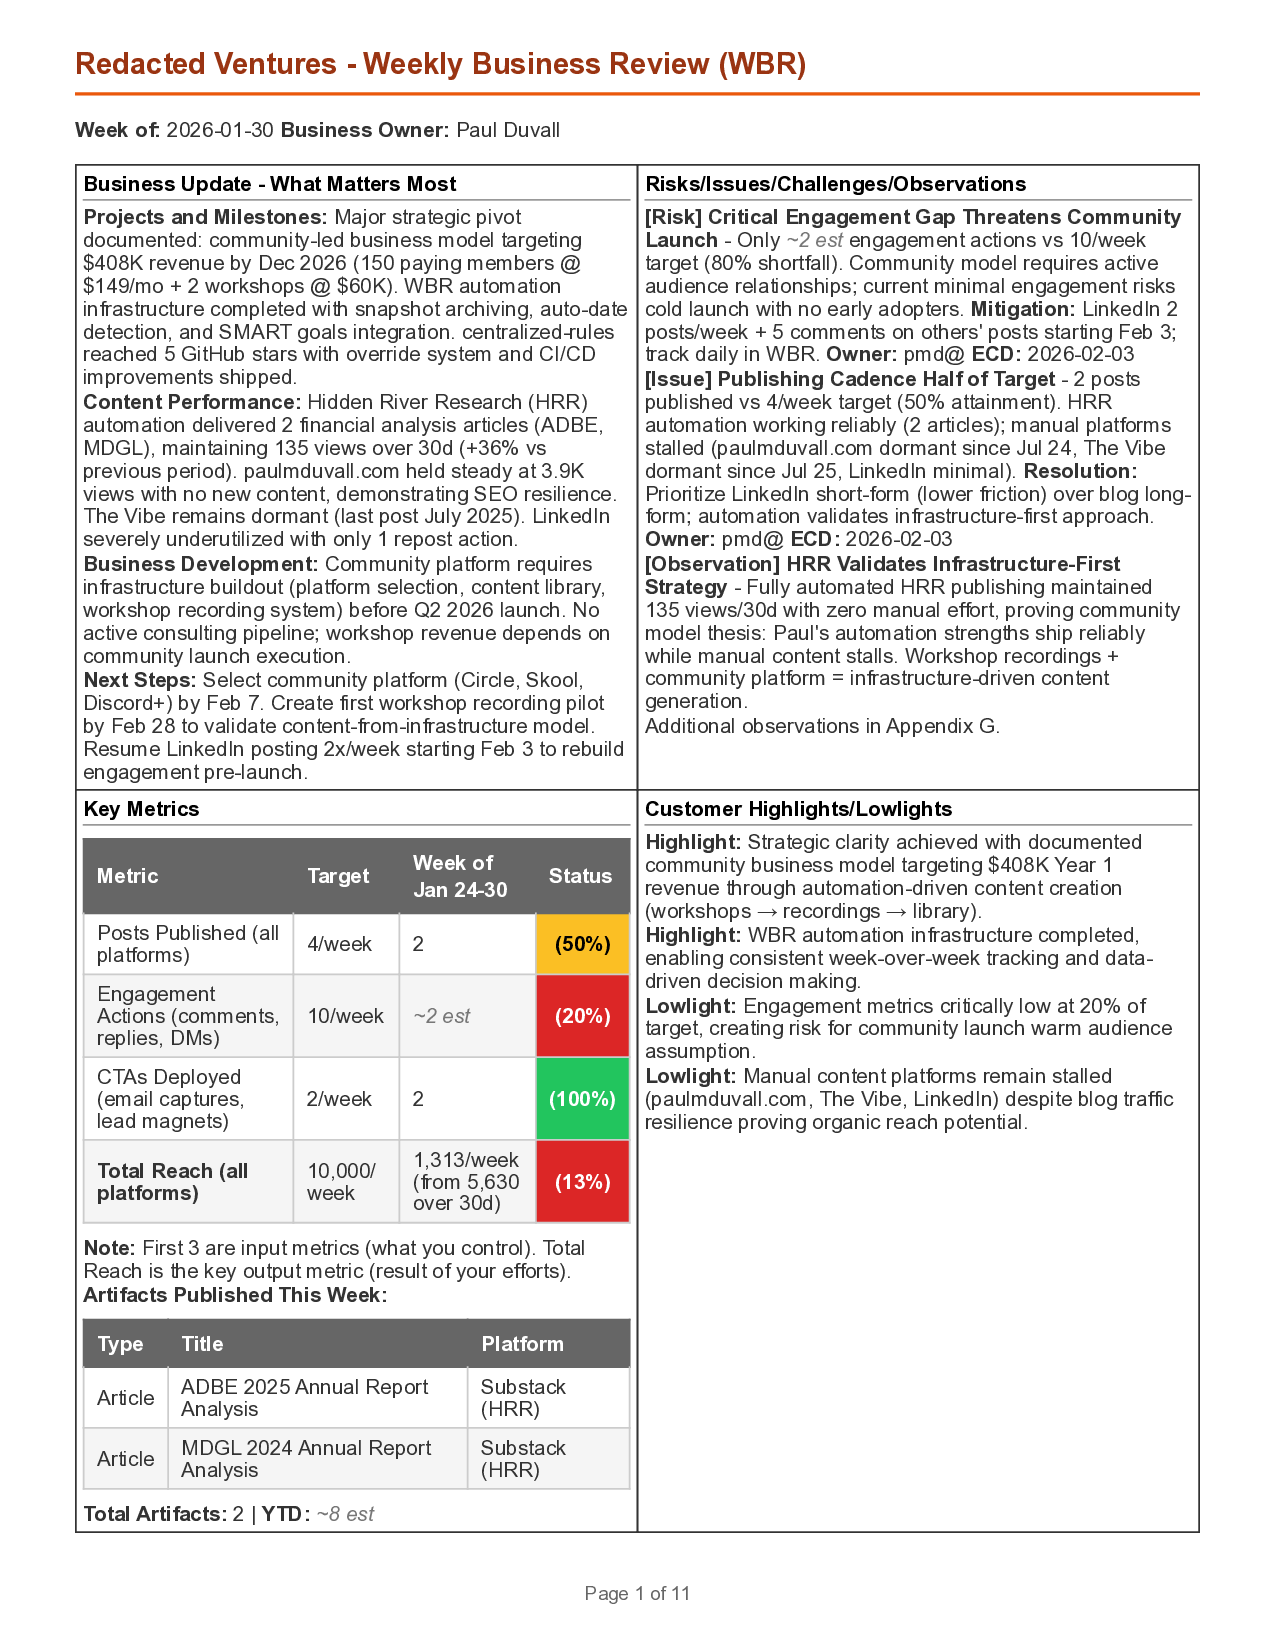
The entire first page fits Amazon's 2x2 grid format: Input Metrics (what I control), Output Metrics (results), RICO (critical issues), and Next Steps (actions with owners). All generated automatically from daily notes and automated metric collection.
The Impact: From 2+ Hours to 15 Minutes
Before Automation (AWS Reality)
- ❌ 2-4 hours per week spread across Monday-Tuesday (5-10% of my week)
- ❌ Manual dashboard hunting: Salesforce, Quick Sight, internal tools
- ❌ Chasing teammates for updates via Slack and email
- ❌ Copy-paste errors and reconciling conflicting data
- ❌ Fuzzy memory of what happened Wednesday-Friday the previous week
- ❌ No week-over-week comparison (too painful to manually compile)
- ❌ Procrastination until Monday night, then panic assembly for Tuesday meeting
After Automation (Current State)
- ✅ 15 minutes Friday afternoon (1% of my week)
- ✅ Automated data collection from all platforms (100% accuracy)
- ✅ All context captured throughout week (daily notes eliminate memory problem)
- ✅ Week-over-week comparison automatic (no manual lookups)
- ✅ Immutable snapshots for longitudinal analysis
- ✅ Actually enjoy reviewing my WBR because insights are ready to use
5-10% → 1% time investment. 10x better data quality. Infinitely better decision-making.
The Real Benefit: Leading Indicators Over Lagging Indicators
The true value of WBRs isn't the weekly ritual—it's the focus on input metrics (what you control) over output metrics (what happens as a result).
As I wrote in my post on Input Metrics, the organizations that win are those who:
- Obsess over controllable inputs measured daily/weekly
- Use tight feedback loops to course-correct fast
- Treat outputs as confirmation, not targets
My automated WBR system makes this practical. Each week I see:
| Input Metric (What I Control) | Output Metric (Result) |
|---|---|
| Posts published: 3 | 30d Substack views: +22% |
| LinkedIn comments written: 12 | LinkedIn impressions: +18% |
| GitHub commits: 47 | GitHub stars: +8 |
| CTAs deployed in content: 4 | Email subscribers: +15 |
When I see "posts published: 0" → "30d views: -12%", I know exactly what to fix. Not vague guesses. Not lagging indicators arriving too late. Actionable data with clear causality.
Automation makes this visibility effortless. I don't spend Friday assembling the data. I spend Friday using it.
How You Can Build This (Even Without My Exact Stack)
You don't need my specific tools to get the benefits. Here are the core principles:
1. Capture Context Daily (Not Weekly)
Set up a simple daily note system:
- Plain text files work fine (
YYYY-MM-DD.md) - Use a template with consistent headings
- Capture 2-3 bullets each day before you close your laptop
- Focus on: highlights, lowlights, decisions, observations
Tools: Obsidian, Notion, VS Code, even Apple Notes. Doesn't matter. Just write it down today, not Friday.
2. Automate Metric Collection
Stop logging into dashboards manually. Options:
- APIs: Most platforms (Salesforce, Google Analytics, GitHub) have APIs. Write a simple script to fetch weekly.
- Browser automation: Use Playwright, Puppeteer, or Claude Chrome plugin to scrape dashboards.
- Zapier/Make/n8n: No-code automation to pull data into a spreadsheet.
The goal: One command (or one button) should fetch all your data.
3. Standardize Your WBR Format
Create a template with:
- Input Metrics (what you control): posts published, calls made, PRs merged
- Output Metrics (what happened): revenue, traffic, customer satisfaction
- Week-over-week comparison: This week vs. last week (% change)
- RICO: Risks, Issues, Challenges, Observations (prioritized P0/P1 on page 1)
- Next Steps: Who, what, by when
Save the template. Use it every week. Don't reinvent the format.
4. Automate Week-over-Week Comparison
Store each WBR with a date-based filename: wbr-2026-01-30.md
Write a simple script (or use AI) to:
- Read last week's WBR
- Read this week's WBR
- Calculate deltas
- Flag trends (up, down, stable)
You can do this in Python in ~50 lines. Or ask Claude to write it for you.
5. Use AI to Generate Insights
Don't just collect data—analyze it. Feed your WBR data to Claude, GPT-5, or any LLM with a prompt like:
Compare this week's metrics to last week's. Identify:
1. Biggest improvements (and likely causes)
2. Biggest declines (and likely causes)
3. Anomalies or unexpected patterns
4. Recommended actions for next week

Be specific. Reference numbers.
This is where automation becomes intelligence. The AI spots patterns you'd miss.
6. Make It Immutable
Save each week's WBR permanently:
- Git commit: Simple, works for markdown/text
- Snapshots folder:
snapshots/2026-01-30/with all artifacts - Checksums: SHA256 hashes to detect tampering
Why immutable? Because in 6 months, you'll want to review "how did we go from X to Y?" and you need an unchangeable record.
The Mechanism Mindset: Good Intentions Don't Work
Jeff Bezos's phrase, "Good intentions don't work. Mechanisms do," applies perfectly to WBRs.
Intentions:
- "I'll remember to collect metrics every week"
- "I'll write down important decisions as they happen"
- "I'll compare to last week's numbers"
Reality:
- You forget
- You're too busy
- Monday night comes and you reconstruct everything from memory while scrambling for Tuesday's meeting
Mechanisms:
- Daily note script that takes 2 minutes (automated prompt)
- Metrics collection script that runs with one command
- WBR generation that fetches last week's data automatically
- PDF creation that validates format compliance
Mechanisms are algorithms for humans.
Treating Your WBR as an Organizational API
One way to think about this automation system is as an "Organizational API"—a well-defined service interface that anyone can consume without needing to understand the implementation details. Just like software APIs, organizational capabilities work best when they have clear inputs, outputs, and usage patterns.
This concept aligns with the principles from Team Topologies by Manuel Pais and Matthew Skelton, which advocates for treating teams and capabilities as services with well-defined interaction modes. When you design organizational capabilities like software APIs, you reduce cognitive load and enable autonomous consumption.
My "WBR Service" has a clear API:
Service: Weekly Business Review Generation Interaction Mode: X-as-a-Service (self-service) How to Use:
- Run
./new-daily-note.sh -eeach day (2 min) - Friday: Paste data collection prompt into Claude Chrome plugin (5 min)
- Friday: Paste WBR generation prompt into Claude (5 min)
- Friday: Run
./make-pdf.shand./snapshot-wbr.sh(3 min)
Outputs: Professional PDF, DOCX, immutable snapshot, week-over-week analysis
SLA: 15 minutes total time, 100% data accuracy
If I were at AWS today, I'd expose this as a Work API:
POST /wbr/generate
{
  "week_ending": "2026-01-30",
  "daily_notes_path": "./daily-notes/",
  "metrics_sources": ["substack", "linkedin", "github", "medium"]
}

Response:
{
  "wbr_markdown": "s3://wbr-outputs/wbr-2026-01-30.md",
  "wbr_pdf": "s3://wbr-outputs/wbr-2026-01-30.pdf",
  "snapshot_id": "snapshot-2026-01-30",
  "comparison": {
    "vs_previous_week": "2026-01-24",
    "metrics_delta": { ... }
  }
}
Teams could consume the WBR service without knowing how it works internally. Just provide inputs, get outputs. That's the power of treating organizational capabilities as APIs.
What I Wish I'd Built at AWS
Looking back at my time as a Director at AWS, I wish I'd built this system then. Not just for me—for my entire org.
Imagine if every team lead had:
- A daily notes system capturing context as it happened
- Automated metrics collection from all internal dashboards (Salesforce, Quick Sight, internal analytics)
- Automated aggregation of teammate inputs (no more chasing people down)
- One-click WBR generation with week-over-week analysis
- Immutable snapshots enabling longitudinal trend analysis across quarters
We would have:
- 10x productivity improvement in WBR creation (2 hours → 10 minutes per person per week)
- Higher data quality (no copy-paste errors, no forgotten context)
- Longitudinal insights (6-month trends, seasonal patterns)
- Consistent format (making cross-team comparison actually possible)
Instead, every leader manually assembled their WBR, in slightly different formats, with varying data quality, consuming 5-10% of their week.
If you're at AWS (or Amazon, or any company using WBRs), build this. You'll thank me later.
The Long-Term Payoff: Decisions, Not Data Collection
The ultimate benefit of WBR automation isn't saving 2-4 hours per week. It's what you do with those hours—and with the superior data quality that comes from automated, consistent collection.
Since automating my WBR:
- I've identified content strategies that work (posts with specific CTAs → 3x email conversion)
- I've killed strategies that don't (LinkedIn carousel posts → low engagement, high effort)
- I've spotted trends 2 weeks earlier than I would have manually (GitHub traffic correlates with Substack subscribers +2 week lag)
- I've built systematic habits (daily notes) that compound over time
Data-driven decisions are only possible when data collection is effortless.
Manual WBRs create a perverse incentive: do the minimum data collection required and avoid asking deeper questions because gathering more data is painful. Automated WBRs flip the incentive: you want to explore the data and ask follow-up questions because insights are ready and refreshing data is effortless.
That's the mindset shift Amazon was chasing with WBRs. And automation is what makes it sustainable—not just at enterprise scale, but for businesses of any size. I run a small business, and WBRs are still valuable because the cost is near-zero and the insights are high-fidelity.
Final Thought: Engineer Your Own Feedback Loops
In my post on Input Metrics, I wrote:
"Predictable success isn't an accident. The organizations that consistently scale and innovate manage controllable inputs with discipline."
WBRs are the mechanism for that discipline. But only if they're sustainable.
If you're spending 2-4 hours per week hunting across dashboards, chasing teammates for updates, and manually assembling your WBR, you're doing it wrong. Build the system I described. Capture context daily. Automate metric collection. Generate insights with AI. Create immutable snapshots.
Your week will thank you. Your decision-making will improve. And you'll finally have the operational clarity Amazon knew was possible all along.
Good intentions don't work. Mechanisms do.
Now go build yours.
This 12-page starter kit gives you five fillable worksheets to build a WBR that works: a readiness scorecard, an input vs. output metric classifier, a metric selection filter, a 30-minute meeting template, and a 7-step mechanism audit.
Get the WBR Starter Kit →
Resources
- Working Backwards - The definitive book on Amazon's operational principles
- Input Metrics & Weekly Business Review - Detailed explanation from former Amazon executives
- Team Topologies - How to organize teams and capabilities as well-defined service interfaces
- My post on Input Metrics - Why controllable inputs beat lagging outputs
- Mechanisms framework - How to build self-reinforcing systems