The WBR Mechanism: Architecture of a Weekly Business Review System
I'm building a WBR toolchain using AI-native development and sharing the journey: the architecture, the mechanism, and the patterns. Here's what's built, what's next, and a sample masked report you can download.

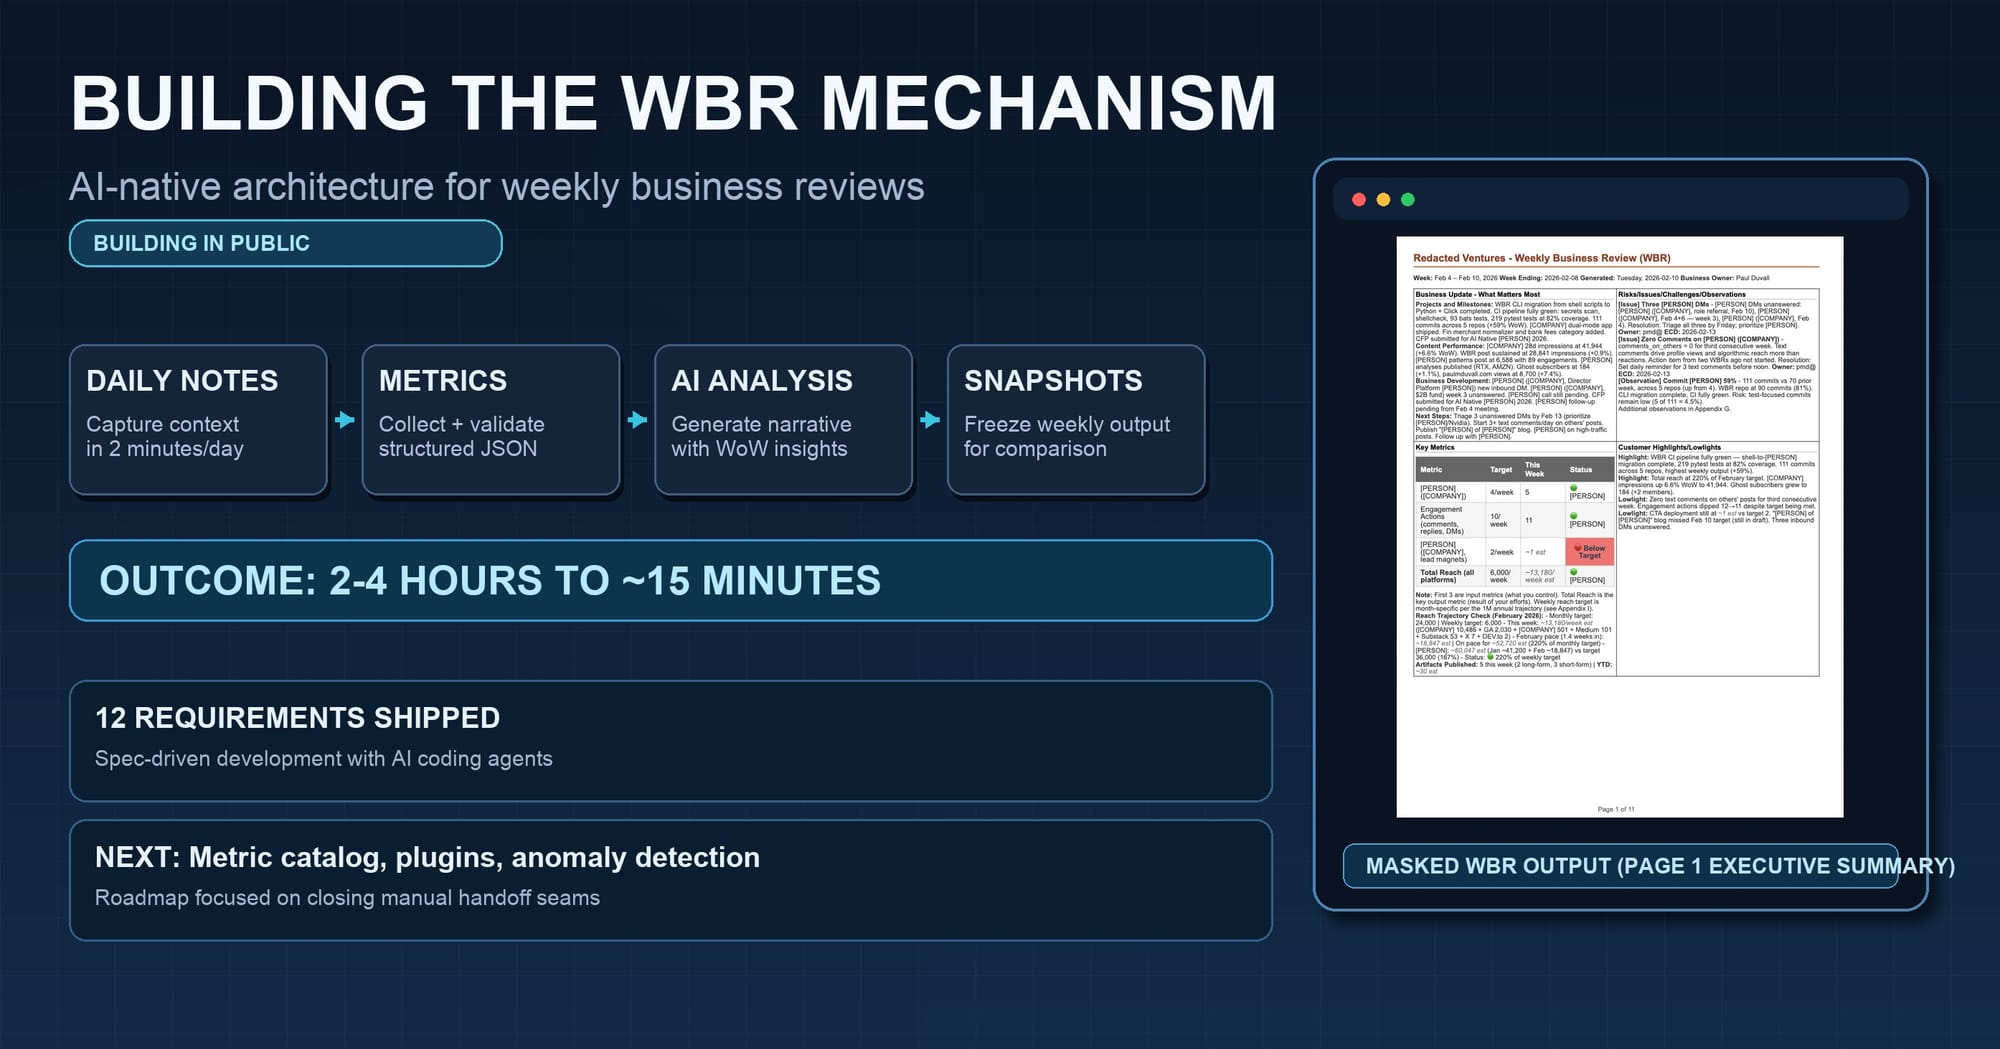
I've written before about automating the WBR process: why I built it, the pain it replaced, and how 2-4 hours of manual weekly assembly (logging into dashboards, chasing teammates, copy-pasting metrics, reconstructing context from memory) collapsed to 15 minutes of reviewing AI-generated output. That post was about the why and the workflow.
This post is about the what and the how. The architecture behind the toolchain, how the pieces fit together, what's planned next, and what a real (redacted) WBR looks like when it comes out the other end.
The weekly discipline of data-driven reflection predates Amazon. WBRs are one implementation of it. The tooling I've built is informed by my experience as a Director at AWS, but the principles apply regardless of where you've worked: capture context daily, automate collection, compare week-over-week, preserve immutable records.
The Toolchain at a Glance
Everything runs through a single CLI entrypoint:
./wbr.sh <command>
That one script routes to over a dozen capabilities. No GUI. No SaaS dependency. Just shell scripts, Python (Click CLI framework), and markdown.
Here's the current command surface:
| Command | What It Does |
|---|---|
bootstrap |
One-command setup: idempotent, safe to re-run |
init |
Interactive setup wizard (configure .wbr-config) |
profile |
Activate a named customer profile |
week |
Run the weekly one-button flow (the Friday ritual) |
new |
Create a daily note from template |
note |
Open today's daily note for editing |
new-wbr |
Generate a WBR from template with optional metrics |
pdf |
Generate PDF and DOCX from WBR markdown |
pdf-interactive |
Interactive PDF generation flow |
snapshot |
Create an immutable, checksummed snapshot |
compare |
Side-by-side comparison of two snapshots |
qa |
Run quality gates: tests, lint, coverage |
doctor |
Check environment and print setup tips |
Run ./wbr.sh with no arguments and it defaults to week, the most common operation.
There's also a pure-prompt workflow for people who prefer Claude interfaces over the terminal. Three pre-written prompts handle setup, data collection, and WBR generation entirely through Claude Code or claude.ai, with no shell commands required. The CLI and prompt workflows produce the same output; they're two paths to the same result.
What's Implemented: 12 Specs, Shipping
I structured the project around specs written in EARS format (Easy Approach to Requirements Syntax), a structured template that uses patterns like "When [trigger], the system shall [response]" and "While [state], the system shall [behavior]" to eliminate ambiguity. Each spec includes acceptance criteria, traceability, and a dependency graph. Not because this is enterprise software yet, but because EARS-format specs make it easier to build with AI agents. When an AI coding agent (Claude Code, Codex, Kiro) can read a spec with unambiguous acceptance criteria, I get closer to working code on the first generation. On the masking engine, for example, an EARS-format spec with SHALL/SHALL NOT criteria produced an implementation that passed 11 of 12 acceptance criteria on the first run. A conversational prompt for the same feature required four rounds of iteration to reach the same coverage. Both approaches work; specs just shorten the loop. This is the Spec-Driven Development pattern in practice.
Here's what's live:
Daily Notes and Aggregation
The foundation of the whole system. Every day I run:
./wbr.sh note -e # Create today's note and open it in my editor
The template has 13 sections: Projects, Content, Risks, Issues, Challenges, Observations, Highlights, Lowlights, Business Development, Time Spent, Engagement Actions, Quick Metrics, and Notes. That sounds like a lot, but most of it fills itself through automation or gets captured digitally elsewhere. Metrics come from platform APIs. Git activity comes from commit history. Content published comes from the publication calendar.
What I actually type each day is usually one or two short notes about things that wouldn't be captured digitally: a conversation with someone, a decision made on a call, an observation about a pattern I'm noticing. Something like:
## Observations
- GitHub stars correlate with blog post timing, ~2 day lag

## Notes
- Call with [person] about potential WBR engagement for their ops team
That's it. The template gives every section a place to land, but on any given day most sections stay empty. Takes 1-2 minutes.
On Friday, aggregation pulls the whole week together:
./wbr.sh week
The aggregator scans the trailing 7 days of daily notes, extracts content from each section, filters out template placeholders and empty bullets, and produces a WBR draft with all the raw material assembled. It also writes a metadata sidecar (-meta.json) tracking which notes were consumed and what was extracted.
One-Button Workflow
The week command is the Friday ritual. One command handles the full sequence:
- Computes the reporting period (configurable timezone, default Eastern, with cutoff)
- Builds a data-collection prompt and copies it to clipboard. I paste this into Claude's Chrome plugin while logged into my platforms. Claude reads the dashboards and returns structured metrics as JSON.
- Once Claude returns the metrics, I copy the JSON output back. The system accepts it via clipboard, file path, or manual paste.
- Parses and validates the metrics against a JSON schema
- Renders a markdown handoff with formatted tables ready for WBR generation
- Opens a second pre-written prompt (the WBR comparative analysis prompt) which I paste into Claude. Claude reads the handoff, fetches last week's WBR for comparison, and generates the full report with week-over-week analysis.
The data collection prompt covers nine platforms: Substack, LinkedIn, Google Analytics, GitHub (multiple repos), Medium, Ghost, X/Twitter, DEV.to, and my personal blog. Each platform section includes specific URLs and what metrics to extract. Claude visits each one and returns a single JSON block conforming to the metrics schema.
The design principle: minimize the number of decisions I need to make on Friday afternoon. The system makes the decisions; I review the output. The current workflow still requires running CLI commands and copying prompts between the terminal and Claude. It's dramatically faster than the manual process it replaced, but there are visible seams where the remaining handoffs can be automated.
Metrics Pipeline
Metrics flow through a three-stage pipeline:
Parsing: Extracts JSON from fenced code blocks, inline JSON, or raw text. Validates against a JSON schema that defines the full structure: content published, platform metrics, engagement actions, Git activity, and data collection notes. Fails with human-readable errors that include JSON paths, not stack traces.
Rendering: Converts validated JSON into a markdown handoff with formatted tables. This is the document Claude reads when generating the full WBR. It contains all the numbers in a format optimized for comparison with the prior week.
Generation: Converts WBR markdown to PDF (via WeasyPrint) and DOCX. Parses the 2x2 grid format, a four-quadrant executive summary on page 1. Applies CSS styling with status indicators: 🟢 on track (≥90% of target), 🟡 at risk (70-89%), 🔴 below target (<70%), ⚪ no data. Skips regeneration if output is newer than input.
Multi-Customer Profiles
The system supports named profiles for different businesses or clients. Each profile gets its own configuration, masking rules, and output directory:
./wbr.sh init              # Interactive setup wizard
./wbr.sh profile acme      # Switch to the Acme profile
Profile configs store company name, business owner, domain, platform IDs (LinkedIn username, Substack slug, GA property ID, GitHub repos), and reach targets. Metrics files and snapshots are prefixed with the profile name. This is how I run WBRs for multiple contexts from the same toolchain.
Data Masking
This was a non-obvious requirement that became essential. When I share WBR examples publicly (like the one later in this post), real names, company names, and sensitive references need to be redacted.
The masking engine handles:
- Person names with company parentheticals:
Jane Smith (Acme Corp, VP)→[PERSON] ([COMPANY], VP) - CamelCase company-like tokens
- Full person names while protecting months, days, and non-person words
- Allowlists for names and companies that should remain visible
- Preservation of markdown headings and bold field labels (you don't want
**Status**masked as a person name)
Masking config resolution follows a hierarchy: explicit --config flag, active profile's masking.json, then the default config/masking.json.
./wbr.sh pdf output/wbr-2026-02-07.md --mask
One flag. Masked PDF and DOCX alongside the unmasked versions.
Immutable Snapshots
Every week's WBR gets frozen:
./wbr.sh snapshot output/wbr-2026-02-07.md
This creates a read-only directory under output/snapshots/ containing the WBR markdown, the metrics handoff used for generation, the validated metrics JSON, and SHA256 checksums for integrity verification. All files are set to read-only (444 permissions).
Revision tagging (rev-MMDD-HHMM) handles same-week re-snapshots when I regenerate after corrections.
Snapshot Comparison
./wbr.sh compare 2026-01-31 2026-02-07
Side-by-side delta across four dimensions:
- Metadata: Snapshot dates, creation timestamps, file counts
- Metrics: Numeric deltas with percent change calculations (green for up, red for down)
- Content: Lines added/removed, RICO entry count changes
- Sources: Daily note count changes
RICO (Risks, Issues, Challenges, and Observations) is the section of the WBR where I track what needs attention. It's similar to a risk register, but broader: challenges are things that are hard, observations are patterns I'm noticing. P0 and P1 items surface on page 1; lower-priority items live in the appendix.
This is the capability I never had at AWS, not because AWS lacked dashboards, but because comparing two weekly narrative documents with metrics, RICO items, and qualitative context across weeks was never automated. The dashboards showed real-time numbers. This shows what changed in the full picture between two points in time.
What the Output Looks Like
Here's page 1 of an actual WBR from Redacted Ventures, run through the masking engine. This is the same document I review every Friday: the executive summary in the 2x2 grid format.
The four quadrants: Business Update (projects, content performance, business development, next steps), RICO (P0/P1 risks, issues, challenges, and observations with owners and ECDs), Key Metrics (input metrics I control (posts published, engagement actions, CTAs deployed) and total reach, each with targets and 🟢🟡🔴 status indicators), and Highlights/Lowlights (what went well and what didn't).
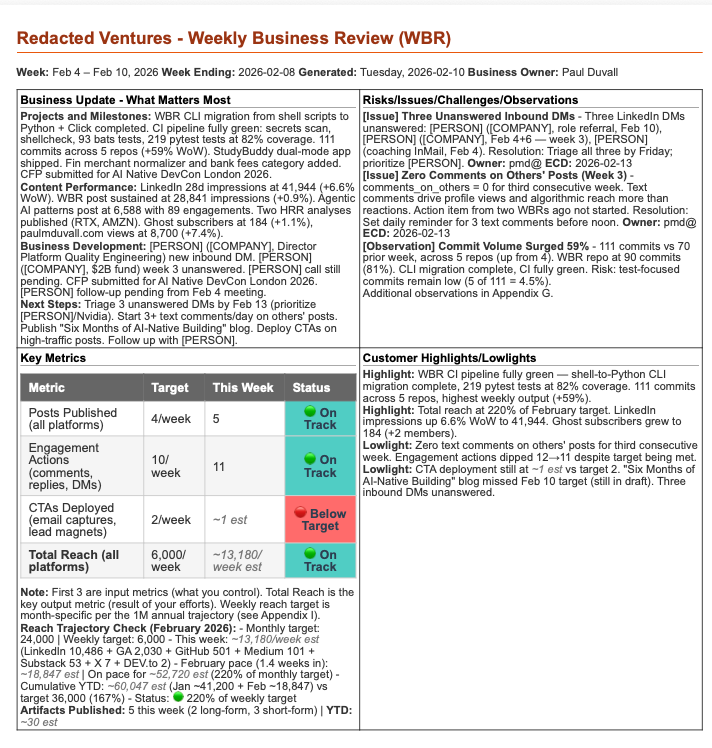
The full report runs about 10 pages across nine appendices: platform metrics detail, content engagement metrics, revenue and monetization, publication calendar, action items (new and carryover), Git commit activity by repo and type, additional insights, SMART goals, and reach trajectory with monthly targets and cumulative YTD progress.
What's Next
The implemented toolchain covers the core weekly workflow. If you noticed the manual steps in the one-button workflow (running commands, copying prompts, pasting metrics JSON back), the roadmap is largely about closing those gaps.
Metric Catalog: A central metric-catalog.yaml defining every tracked metric with its owner, target value, collection frequency, and guardrail bounds. Today, metric definitions live implicitly in the JSON schema and rendering templates. The catalog makes them explicit: one source of truth for validation, rendering, and everything downstream.
Pluggable Ingestion: A plugins/ directory where each data source is a self-contained folder with a manifest and an executable. Drop in a new folder, and the system discovers it at runtime. Plugins can wrap CLI tools, scrape dashboards, or call platform APIs directly for sources that support programmatic access. No more hardcoding data sources.
Time Comparisons: Automatic WoW, MoM, MTD, QTD, and YoY calculations for every numeric metric. Today I get WoW because I compare to last week's snapshot manually. This makes all comparison periods automatic.
Anomaly Detection: Metrics that breach guardrail bounds or show unusual movement get flagged automatically. No more scanning every number hoping I notice the one that matters.
Beyond that, the plan includes a REST API, a web service for hosted generation, shareable report URLs with optional password protection, interactive trend charts, and a SQL ingestion plugin for teams whose metrics live in warehouses.
How I'm Building This: AI-Native Development in Practice
Every one of the 22 specs (12 implemented, 10 planned) follows the same pattern:
- Write the spec with a user story and acceptance criteria using SHALL/SHALL NOT language
- Point an AI coding agent at the spec and let it generate the implementation
- Run the tests, iterate on failures, refine
- Snapshot the result as part of my own weekly WBR workflow
The EARS-format specs aren't ceremony. They're what makes AI-assisted development predictable. I mentioned the masking engine earlier: 11 of 12 acceptance criteria passed on the first generation from an EARS-format spec. That's not universal. Simpler specs sometimes pass clean, complex ones sometimes need more iteration. But the pattern holds: unambiguous acceptance criteria reduce the back-and-forth. This is one effective approach; conversational iteration works too. Specs just shorten the loop for me.
The dependency graph matters too. Specs 13–22 are sequenced deliberately: metric catalog before time comparisons, time comparisons before anomaly detection, anomaly detection before charting. Each phase unlocks the next. That's how I plan work for AI agents to execute effectively.
The Full Mechanism
If you've read my post on mechanisms, the Amazon concept that "good intentions don't work, mechanisms do" (a principle Jeff Bezos emphasized repeatedly), you know a mechanism isn't just a tool. It's the complete system: challenge, outcomes, tools, adoption, inspection, inputs, and iteration.
The toolchain described in this post is the tools component. Here's how the full mechanism works in practice:
Business Challenge: Running a business without systematic weekly reflection leads to drift: missed signals, repeated mistakes, decisions based on memory instead of data.
Desired Outcomes:
- WBR generation in under 15 minutes (down from 2+ hours)
- Elimination of manual transcription errors (automated collection replaces copy-paste; different failure modes like API changes and stale credentials exist, but manual data entry errors are gone)
- Week-over-week trend visibility without manual lookback
- Context captured daily, not reconstructed Friday night
Tools: The WBR toolchain: daily notes, aggregation, metrics pipeline across nine platforms, PDF generation with status indicators, masking, snapshots, comparison. Both CLI and prompt-driven workflows.
Adoption: A single CLI entrypoint with sensible defaults, or a pure-prompt workflow for non-terminal users. Daily notes take 2 minutes. The Friday workflow is one command to start, two prompts to complete, one command to finish. The init wizard handles first-time setup interactively. Profiles make multi-customer use seamless.
Inspection: Snapshot comparison surfaces what changed week-over-week: metrics, content, RICO items, data quality. I still interpret the deltas; the system surfaces them. In week 7 of using this, the comparison flagged that LinkedIn engagement had dropped 35% WoW while my posting frequency was up. I hadn't noticed in the LinkedIn dashboard because impressions were flat. The drop was in comments and shares. That RICO entry changed my content approach for the next three weeks. Without the structured comparison, I would have missed it entirely.
Inputs: 2 minutes per day capturing daily notes. Platform credentials for metrics collection across nine platforms. The WBR template defining metric targets and monthly reach ramp (targets increase month-over-month as the business grows).
Iteration: The roadmap is the iteration plan. Metric catalog, pluggable ingestion, time comparisons, anomaly detection. Each phase tightens the feedback loop. Once anomaly detection ships, the system will flag breaches automatically instead of relying on me to scan the comparison output.
Get the Full WBR
I review a ~10-page WBR with my business partner every Friday. Page 1 gives me the executive summary in four quadrants with status indicators. The appendices cover platform metrics detail, content engagement, revenue, publication calendar, action items, Git activity, insights, SMART goals, and reach trajectory, all generated from daily notes and automated data collection across nine platforms, all with week-over-week comparison.
I've published a complete masked version: the exact report I use, with names and companies redacted.
10 pages. Real data, real structure, real RICO items. Names and companies masked. See the format, the metrics, and the week-over-week analysis from an actual weekly review.
I've been building and refining this system every week for months. The toolchain keeps getting better because I'm the primary user. Every Friday surfaces something to improve. If you're running WBRs today, or thinking about starting, and you want help building this kind of operational system for your business (the architecture, the metric design, the adoption plan), that's one of the things I help customers do at Redacted Ventures.
As Bezos put it: good intentions don't work. Mechanisms do.
This 12-page starter kit gives you five fillable worksheets to build a WBR that works: a readiness scorecard, an input vs. output metric classifier, a metric selection filter, a 30-minute meeting template, and a 7-step mechanism audit.
Get the WBR Starter Kit →
Resources
- From Dashboard Hell to One-Click WBRs: Why I built this and the workflow it replaced
- SpecDriven AI: The development methodology behind this project
- Working Backwards by Colin Bryar and Bill Carr: The definitive book on Amazon's operational principles, including WBRs and mechanisms
- Input Metrics: Why controllable inputs beat lagging outputs
- Mechanisms: How to build self-reinforcing systems
- Redacted Ventures: AI-native development guidance and coaching